Update on the Rental Bubbles & Crashes in US Cities – WOLF STREET
THE WOLF STREET REPORT
Imploded Stocks
Banks
Brick & Mortar
California Daydreamin’
Canada
Cars & Trucks
CRE
Companies & Markets
Drunken Sailors
Credit Bubble
Cryptos
Debtor Nation
Energy
Europe
Federal Reserve
Housing Bubble 2
Inflation & Devaluation
Japan
Jobs
Let’s start with Chicago and then swing to Southern California to get a flair for the drama on the ground that gets averaged out in the national figures.
Chicago rents peaked in the fall of 2015 and have since spiraled lower. In July, the median 1-BR asking rent dropped 5% from a year ago, to $1,510, and is down 26% from the peak in October 2015. For a 2-BR, median asking rent plunged 13.6% year-over-year and is down 30% from the peak.
Like other cities, Chicago has an apartment construction boom. In the Chicago-Naperville-Elgin metro area, 10,700 apartments are expected to be delivered in 2018, for a population of 9.5 million. And this is a problem – because Chicago’s population has dropped by 27,000 people since its peak in 2014. In late 2015, asking rents peaked. As new apartments came on the market and as more people left, demand withered and rent began to spiral down.
But rents in Southern California are soaring. In Los Angeles, the median 1-BR asking rent, after setting a record in June, ticked down in July to $2,330. The median 2-BR asking rent also set a record in June and ticked down in July to $3,210 – the second most expensive 2-BR asking rent in the country, after San Francisco. Rents for 1-BR and 2-BR apartments in San Diego soared 15.6% and 8.4% in July compared to a year ago. In Santa Ana, Anaheim, and Long Beach, a similar scenario is playing out.
But on a nationwide basis, these dramatic differences between individual metros get averaged-out: Median asking rent for 1-BR apartments across the US rose 2.7% in July compared to a year ago, to $1,208. And for a 2-BR, it rose 2.7% to $1,446.
These are median asking rents – “median” means half are higher and half are lower – in multifamily apartment buildings, including new construction, as they appeared in active listings as apartments for rent in cities across the US. The data, collected and released by Zumper, reflects the current market as landlords are trying to price it. The data in Zumper’s National Rent Report does not track the actual rents agreed to between landlord and tenant and does not include “concessions,” such as “1 month free” or “2 months free.” Single-family houses for rent are also not included.
The table below shows the 17 of the 100 most expensive major rental markets in the US. The shaded area shows peak rents and the movements since then. The black “0%” in the shaded area means that these markets set new records in July. If rents are down by a few bucks from the peak a few months ago, it doesn’t yet mean that the market has turned – a turning point would require more prolonged data. For the first time, the list includes Denver: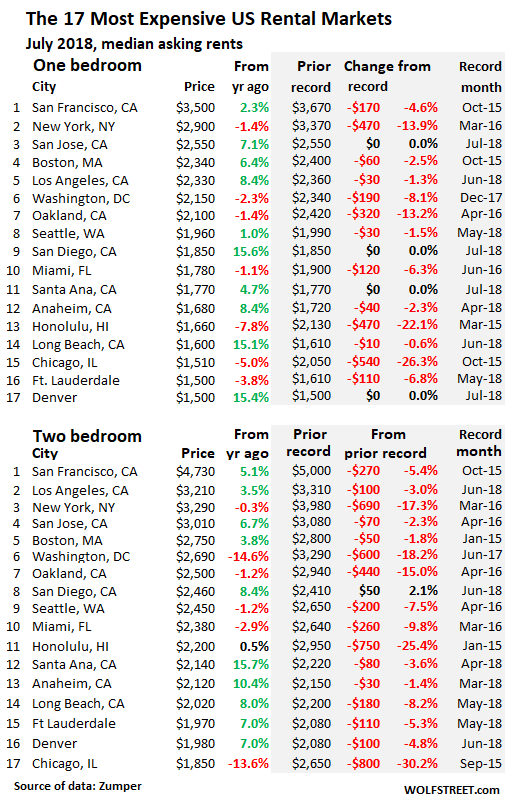
Washington DC rents have suddenly come under pressure: 1-BR rents in July are down 8.1% from their peak just last December. And 2-BR rents have plunged 18.2% from the peak in June 2017. That was fast.
Honolulu rents are struggling to find a bottom. The 1-BR rent fell 7.8% year-over-year and is down 22% from the peak in March 2015. But the 2-BR rent it ticked up 0.5% from a year ago to $2,200 though it remains 25% below the peak in January 2015.
New York City had long been the second-most expensive rental market in the country, after San Francisco. But in May, the median 2-BR asking rent fell into third place, behind Los Angeles, due to dropping rents in New York and soaring rents in Los Angeles. Note the double-digit declines from the peak.
In San Francisco, the most expensive major rental market in the US, rents peaked in October 2015, then began to descend sharply before starting to tick up again, but remain below their 2015 peak.
With the asking rent for a 1-BR at $3,500 and for a 2-BR at $4,730, and with 1,503 apartments listed for rent at the moment on Zillow (up 31% from the 1,149 in August 2016), one thing is clear: There’s no shortage of supply but a shortage of supply in a range that households can afford. Hence the local term, “Housing Crisis.” It’s a crisis of affordability, not availability.
In the Seattle metro, 8,600 new apartments are scheduled to be delivered this year, after the surge in 2016 and 2017; and 25,000 apartments are under construction. So a lot of supply is coming on the market. But it’s high-end supply, and affordability has become a crisis too. Despite this onslaught of supply, Seattle’s median 1-BR asking rent hit a record in June, and just inched down from it in July. But 2-BR rents remain 7.5% below the peak in April 2016.
This scenario of some markets experiencing double-digit year-over-year increases, while others are experiencing double-digit declines is playing out across the US. In fact, rent increases of around 15% are common in many of the less expensive markets – from about #60 on down in the list below. For renters living in those markets, the end of a lease can trigger real anguish and worse. For them, the averaged-out national numbers with the soothingly small increases are meaningless.
The table below shows Zumper’s list of the 100 most expensive major rental markets in the US, in order of median asking rent for 1-BR apartments in July, and percentage changes from a year ago (use the browser search box to find a city):
Enjoy reading WOLF STREET and want to support it? You can donate. I appreciate it immensely. Click on the beer and iced-tea mug to find out how:

Would you like to be notified via email when WOLF STREET publishes a new article? Sign up here.![]()
Email to a friend
Let’s put that chart in perspective:
Vienna Austria 2 Bedroom Apt. $330
https://crosscut.com/2017/06/homelessness-housing-crisis-seattle-vienna-solution
https://www.huffingtonpost.com/entry/vienna-affordable-housing-paradise_us_5b4e0b12e4b0b15aba88c7b0
Santiago Chile New 2 bedroom $495
Buenos Aires 1 bedroom city center $333
USA Living in your car +- $600
So … I could take my US Social Security and go live in Vienna? Because with rent at $300 that would leave me about $400 a month to live on which is plenty.
Alex
The answer is basically yes. Although if you choose Vienna you will probably be on a wait list for the nicest neighborhoods and won’t be immune from the housing needs of the immigrants from failed states driven there by the US proxy wars in Syria and Lybia. Private housing rentals are substantially more expensive, and the city is not inexpensive except on the housing front . There are something like 460,000 public housing units in the city!
My impression is that Vienna’s public housing success comes in part from a deeply embedded series of cultural values and stability. It is not divorced from the European uncertainty about whether it can survive the test of rapid absorption of a culturally incompatible wave of immigration with a vastly higher birth rate.
On the other hand if you choose Santiago you have access to great locally grown food and great wine, and that $500 2 bedroom will be brand new and have a great view of the Andes from the upper floors.
Either choice will be much more civilized than San Jose. But Spanish is much easier on the ear than German!
I live in the Ballard area of Seattle. Right in the “urban core” My mailman tells me he has never seen so many vacant residences. All high end. Construction just stopped on another 4-plex a block away. Nothing has been touched in going on two weeks. The amount of new buildings (under construction) with less than 50 units is staggering. Wonderful planning by the central planners.
What’s the difference bewteen a bar of gold and an empty apartment?
Nothing. They both represent a store of value.
So long as the complex breaks even on expenses the natural rise in the value of the bulding will pay off in the end. Fewer tenants mean a more pristine building and more value. If rents rise high enough, perhaps only a tenth of the apartments need be occupied.
If rents rise fast enough, the building need not have any tenants at all and can be bought and sold like a share of stock. Needless to say, if more and more buildings become unoccupied, there will be fewer apartments and rents will rise in tandem.
Limit supply and prices rise.
Well done! I love great sarcasm – really is a lost art that few appreciate.
Regards,
Cooter
“If rents rise high enough, perhaps only a tenth of the apartments need be occupied”
I hate to say this but I actually heard someone say this on a radio talk show about how high rents are. The individual claimed that rents are so high vacancy rates don’t seem to matter AND are much higher than actually reported.
Beyond a certain buffer vacancy rate I can’t understand how as a business any of these complexes would long allow a high vacancy rate and not lower the rent to marginally attract more tenants. I mean if it’s a newer property built within the last ten years at least, they’re probably still trying to make up the cost of building the place right? Keeping a large portion of your units off the market and depriving yourself of the cash flow unless it really was going to crater rental rates (not likely on the margin), makes no sense.
->Needless to say, if more and more buildings become unoccupied, there will be fewer apartments and rents will rise in tandem.
Do this on a large enough scale and you end up with ghost cities in China.
It all makes sense.
Cute, but incorrect – RE is in fact a depreciating asset in the sense that it requires regular maintenance and upkeep outlays to keep it from falling into disrepair. And don’t forget property taxes, which presumably apply to vacant and occupied units equally.
Doggy,
And both gold bars and spec apartments are worthless if nobody wants to buy them. In my little remote area of the woods a subdivision of three hundred 3400 sq ft. “golf course cabins” was build adjoining a new terraformed golf course. They had 10′ lot line setbacks and came packaged with golf course memberships for $400,000 each. By the time 2008 came along most were finished but you couldn’t sell any of them for $200,000. Eventually a hedge fund bought the lot for a rumored 60k each. They repainted the exteriors in individualistic color palates, planted a few shrubs and trees, and completely cleared the inventory by 2017 at 400+k. By the way, the bank holding the defaulted mortgage refused to sell any of them at a discount to private individuals, preferring to save on paperwork by offloading them in a 300 lot package. It would be interesting to see how the cash flowed between the Players in that deal.
Moving on to the value of yellow bars, surely your readers understand that they are basically worthless. Sure, gold is a good material for electrical connections and shiny jewelry. But it has Price (as opposed to Value) for exactly the same reason as do Federal Reserve Notes (AKA dollars). Because people choose to believe in them.
“Delusion is the Opium of the People”
I’m sure some of you have read Cormac McCarthy’s book “The Road” or seen the movie. In that circumstance which metal do you think would have the greatest Value, gold, or lead pressed into a brass cartridge with gunpowder inside?
Well, real estate investors tend to pile in the most profitable markets (explaining the expanding supply) and at one point the investors and experienced speculators start cashing in their chips and giving way to the fly-by-night companies and mom and pops types attracted by sky high valuations and ease of access to credit.
These later types are overwhelmingly interested in making a quick profit, chiefly in flipping the property even before is finished, and are usually marked by the poor attention they pay to financials, chiefly their line of credit. That’s why you often see a beehive of activity one week, then construction suddenly stops and may or may not resume: contractors want to be paid, and even at the top of bubble the financial backers may balk.
Usually the number of “cocooned” construction sites is a good measure of how heavy is the presence of fly-by-night companies and/or how cold the feet of the financial backers are getting. And the higher the presence of hopefuls as opposed to professional investors/speculators, the higher the chances something is about to break.
Regarding city planners… far too often the only things they care about is maximizing impact fees right now and property taxes/junk fees tomorrow. Nothing else matters.
The problem, as many small towns in Spain and Italy discovered, is all that real estate needs to be finished and sold for the check to clear. Simply posting houses for sale at ludicrous prices (some of the stuff I’ve seen in Spain would have made good material for a Father Ted episode) won’t do the trick.
But like the hunter who sold the pelt before shooting the bear, those projected revenues are usually spent in advance, and some, invariably on useless make-work projects for local well-connected or to legally buy the mayor another term.
And in the end all that’s left is a devastated territory and huge mountains of debt…
So, do these continued rent increases mean people are earning more? Consumer spending increases can come from more people working, even if wages are stagnant. But I don’t see how this widespread and continuing increase in rents can be supported unless people are earning more.
What I saw for living in Dallas/FtWorth for twenty years before I moved is … if there are jobs in the area, people move there for work.
Just an informed observation … but … there are two reasons for cities; conviviality and commerce. If that isn’t on your bucket list, move to the country else life is quite miserable and dangerous.
That said, the folks moving in often have to pay to haul their stuff/family and prioritize their “nest” above many other expenses and make things work according to their income(s).
There are a lot of drivers for rents, but to me the biggest has always been the net flow of labor (measured in warm bodies).
When the economy rolls over, so do jobs, and consequently rents (e.g. folks move back to the country with me-maw).
Assuming a reasonably stable economy (locally), other factors take over in the absence.
Regards,
Cooter
I agree and look at the one bedroom rents for DC , 2150 which is absurd Evidently the parasites working for us are being vastly overpaid
parasites don’t work for the host
they feed on it
i learned this by trying to train a mosquito
I think these are new rental rates rather than rents already “in place”. That is, if we reported the averages, they would be different.
Well Bret, that is an interesting point. Every month some number of leases are up for renewal and rental cost can be increased then. Do the reported rent increase numbers only cover new leases, ie for people who change locations, or do they also cover lease renewals.
These are advertised “asking rents.” They do not reflect actual leases signed, current leases in place, rent-controlled rents, etc. They’re a measure of the current market.
I would be extremely helpful to plot the charts of price/rent. Say San Francisco, 2 bed room is 4700*12=56K, but the Median Contdo is 1.5million. P/R =26
What is striking about Denver is how quickly the dynamics have changed. According to this piece the rate of homeownership has dropped from over 70% to a bit over half in less than 15 years.
If the link didn’t show up this is it
https://www.cpr.org/news/story/denver-s-investor-landlords-don-t-want-to-sell-their-houses-the-rents-are-just-too-good
Lots and lots of new apartments underway in Dallas.
Can someone explain how the investing public can obtain data on what apartments actually rent for? Relying on zumper or apartment companies alone is silly- they have a conflict of interest. It is in their financial interest to keep stating that rental prices are going higher. How can we know what the actual price is?
Nimesh Patel,
“Conflict of interest?” Nonsense. If the data were ruled by a “conflict of interest,” you would not see the steep rent declines in the data.
As I point out in the article, Zumper gets this data from millions of advertised “asking rents.” This represents the current market, where it is today. This is just like advertised prices for various consumer goods.
The data doesn’t show how much a guy is paying in rent for a rent-controlled apartment he has been living in for 30 years. There is no actual data for this. And this data would be useless for potential tenants because when he moves out, that apartment — if it’s in San Francisco — goes on the market at current market rent, hence at an “asking rent” in line with the current market, which will be far higher than the guy has been paying. Zumper will pick up this “asking rent” and include it in its data.
How much tenants are actually paying is not tracked by anyone. However, there are survey-based “estimates” such as those used for the CPI calculations. But they use all kinds of formulas to arrive at their result and will not provide you with the answer you’re looking for.
“Asking rents” may not be the perfect data out there, but it’s public data, and it’s trackable, and it’s the only real data available for the current market.
I think the Census Bureau’s American Community Survey tracks Median Gross Rent (with utilities) and Contract Rent. It is available for smaller geographies (zip code, census tract, etc.) as a 5 year average, and for cities, counties, etc. with over 75,000 people for the most recent year surveyed. Rent controlled cities (and metros where they are a significant portion of rentals such as SF and NY) do show a much lower rent than Zumper. The issue of course is that the numbers come out only once a year, and have large sampling error for the smaller geographies.
I was a forced participant in the last ACS (a few months ago). The Census surveys about 100,000 Americans (homeowners and renters … so about 45,000 renters) for the ACS. It then uses formulas and adjustments to come up with its estimates.
In terms of rents, this is based on the responses of the 45,000 renters across the US in the survey. This serves its purpose. But data of this type is totally useless for market watchers.
The CURRENT market is what matters here. The current market is determined by leases signed today — not last year or 20 years ago and rent-controlled from that point on. This data is irrelevant for the current market.
The current market is what is listed for rent today (“asking rents”), and the leases that are signed today.
There is no data on current lease signings. But there is asking rent data. That’s the best we can get.
Yikes. I had no idea they attempt to formulate such detailed data from just 100,000 nationwide responses.
I also received the ACS form 4 or 5 years ago. I took a stab at answering as accurately as possible without pulling out tax returns and utility bills. I did find the form quite intrusive, and was left wondering how many people even bother to make good and honest responses to the questions on the form.
You can get much better data with paid data that professional commercial RE investors pay for. Such as from firms like Axiometrics, REIS, Yardi Matrix. These free web sites like Zumper, Rent Cafe, etc… all seem to come in a good bit higher than what overall rents really are IMO. I think the rents they quote are mostly class A high end newer properties. I’m not sure they accurately represent asking rents for Class B and Class C more garden apts and middle class type housing.
Many of these data firms offer me their data for free since WOLF STREET is a media site and gives them free publicity in return. And I have used their data periodically. This includes two names you mentioned, plus Moody’s, Fitch, S&P, and many others.
But lease signings are not tracked because landlords don’t have to report their leases. Data firms don’t have this data either. There is some sampling going on, and some surveys, but no hard data.
BTW, these data firms can get finicky too. In one of my articles, I said something about S&P that S&P didn’t like, and two hours later they cut me off from access to their data. This is how they manage what is being said about them :-]
Have any idea how this fits into the fabulous GDP calculation? I heard that rents are 50% of the CPI, is that correct? If so there should be a huge variation between real GDP in Europe, where rents are regulated mostly, and the US.
Have past real estate bubbles had the same variation between markets? I’m referring particularly to the time lag between the major market and smaller (cheaper) market peaks.
Someone once opined that a vacant building owner can claim a loss on taxes which can more than make up for the rent.
Also the owners naturally want to keep the prices high so there is inertia.
I don’t have an e-mail for Wolfstreet.com so here goes nothing. Seattle is experiencing some price breaks now called corrections. KING 5 News
.
https://www.king5.com/article/news/local/some-seattle-home-prices-dropping-by-100k-in-market-correction/281-582540081
Thanks.
Comments are closed.
The Home Price Benchmark Index is down 14% from peak in March 2022, Toronto down 15%, after wild and woolly sucker rally over the spring.
This was the last of 12 health insurance adjustments that pushed down core CPI and core services CPI; it will swing the other way next month.
Cost-of-Living Adjustment for 2024 plunges from 2023 mega-COLA, which outran inflation by a wide margin. This one will fall behind inflation.
Obviously, this kind of idiocy should never happen in a healthy stock market. But it has happened a lot.
Or why auto insurance has gotten so ridiculously expensive — after used vehicles have gotten so ridiculously expensive.
Copyright © 2011 – 2023 Wolf Street Corp. All Rights Reserved. See our Privacy Policy